1. Intro
Reports are essential for understanding how effectively your team handles customer conversations. They reveal patterns in response speed, show when you receive the most messages, and highlight how quickly issues get resolved. By checking these metrics regularly, you can figure out where improvements are needed, whether you’re meeting service-level expectations, and how to allocate your team’s time. You can access these reports in your dashboard under Reports. Depending on your permissions, you may see multiple tabs that break down overall performance, team-level metrics, or individual agent statistics. If you’re just getting started, explore each tab briefly and try adjusting filters like date ranges or conversation tags to see which view is most relevant to your goals.2. Understanding Sessions
Sessions also help you control and exclude specific blocks of time, such as non-working hours or agent “away” periods, so your metrics aren’t skewed by factors outside actual conversation handling. You can adjust these settings in the admin panel to reflect your team’s schedule. By default, nights and weekends are considered off-duty, and any messages that arrive then won’t inflate your response or resolution times.🗣️ Scenario Example: A customer messages on Tuesday at 10:00 AM, and an agent responds and resolves the issue by 10:30 AM. This entire interaction counts as a single session. If the customer gets back in touch on the same thread three days later, that follow-up is considered a new session once the old one has been closed.
Inactivity and Auto-Closing Sessions
Many conversations go idle when the customer stops responding, so we use an **inactivity threshold **—24 hours by default— to close sessions that haven’t received any messages for that duration. This prevents your resolution times from ballooning simply because one side isn’t responding. If the conversation picks up again later, a new session begins, providing a fresh metric window.How Follow-Up Time Is Excluded
Some teams need to pause a conversation to wait for additional information, schedule a reminder, or simply follow up much later. Instead of leaving the session open indefinitely, we have two ways of excluding that time from your active metrics:- Short Follow-Up (<24 hours) If an agent sets a follow-up within 24 hours, the session stays open, but the system subtracts this follow-up gap from the agent’s total handling time. That way, your resolution or response metrics don’t get inflated by unnecessary follow-up time.
- Long Follow-Up (>24 hours) If the agent sets a follow-up date more than 24 hours away, the system closes the session right away to keep your metrics clean. Any message that arrives after this closure—whether from the agent or the customer—starts a new session. This ensures data doesn’t blend together across long waits.
Away Agents: Time and Auto-Reassignment
When agents step away for lunch or end their shift, you can enable auto-reassignment (team settings) so that any conversation that receives new message during their absence automatically goes to someone available. This setting avoids extended customer wait times and keeps your reports accurate by attributing work only to active agents. If you prefer more manual control, you can turn auto-reassignment off but away time will still be excluded from the time metrics.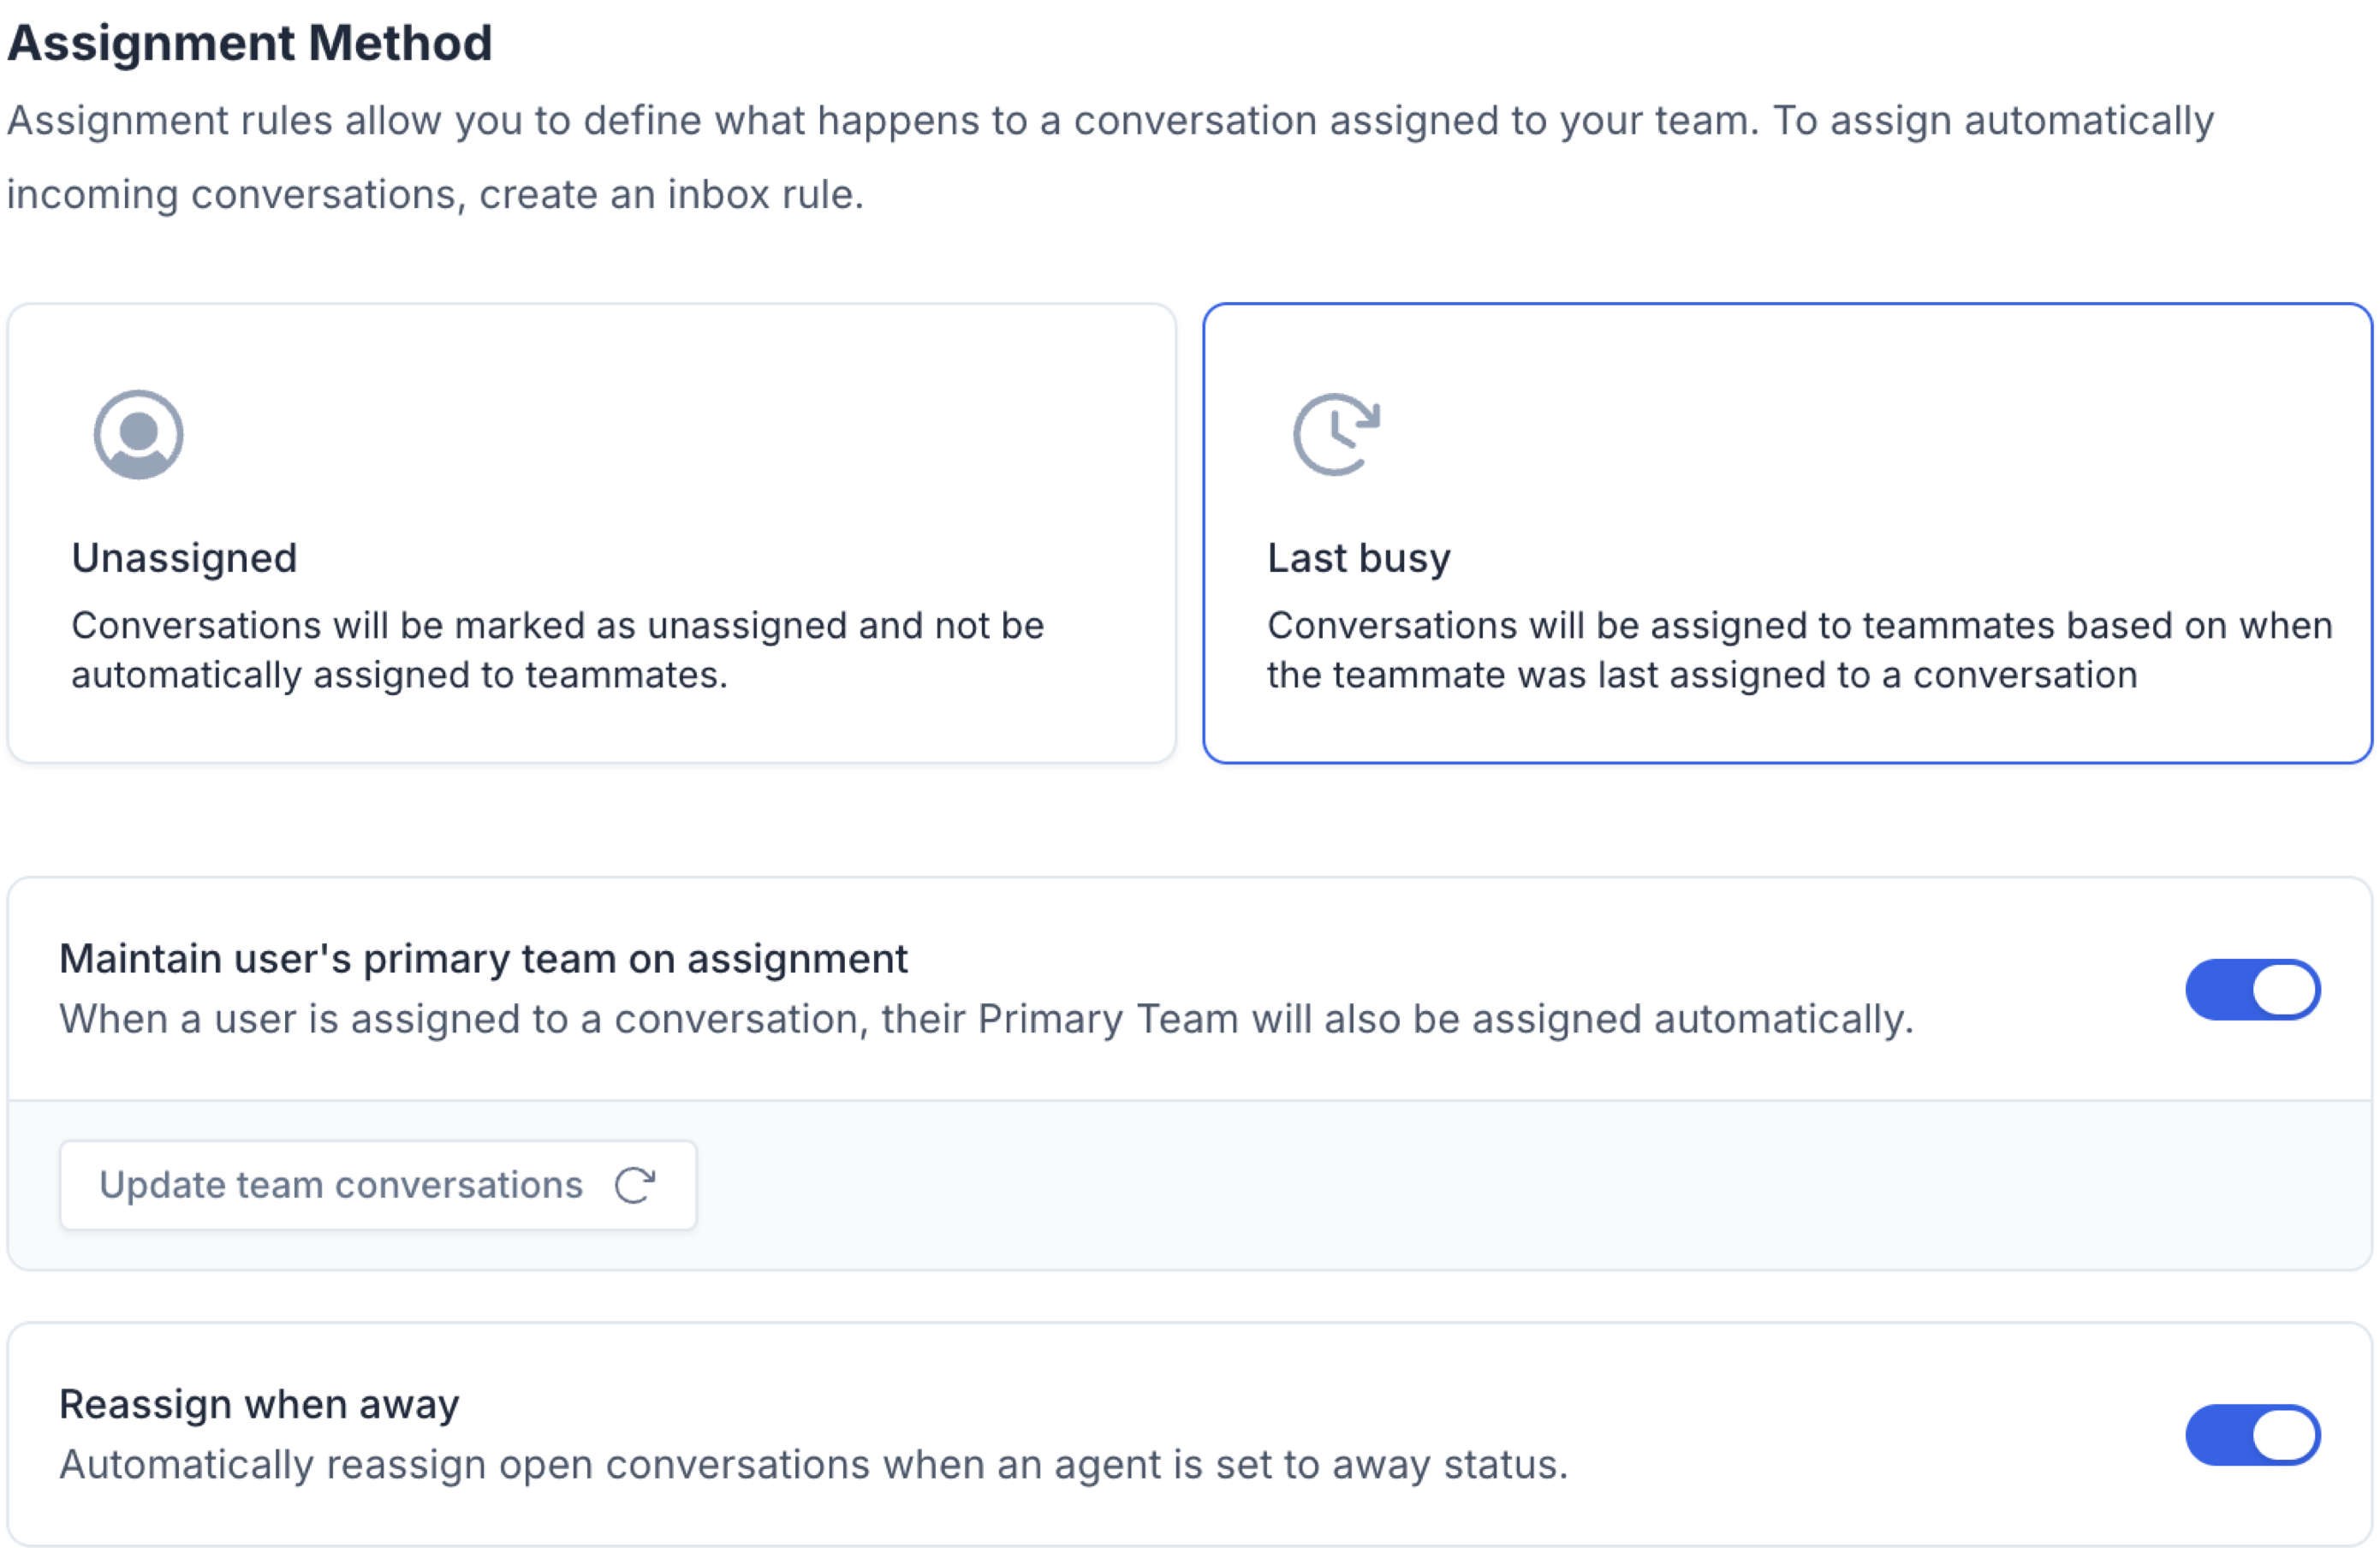
3. Metrics
Below is a table that explains the main metrics you’ll encounter. These definitions show how each metric is calculated and what it indicates about your team’s performance.When referring to conversations, we do refer to the concept of conversation sessions as defined above, allowing you to have metrics that reflect active conversations exclusively.
| Definition & Calculation | |
|---|---|
| Messages Received | This metric shows the total number of inbound messages received from your contacts during the selected time range. Each message is counted once, and only those received within the chosen period are included. Messages sent by agents, system notifications, or messages in deleted conversations are not counted. If a message cannot be linked to a conversation, it may be excluded from the total. The data is grouped by time buckets according to your selected reporting period. |
| Customer Waiting Time | Customer waiting time is calculated by aggregating, for each conversation session, the total time customers spent waiting for agent replies over the selected period. All waiting periods during the conversation are included, not just the first. Each data point on the chart represents the aggregated waiting time for all conversations in that time bucket. The aggregation method (e.g., average, median) is determined by your reporting settings. For more details on session boundaries and inclusion rules, please refer to our documentation. |
| Resolution Time | Resolution Time measures how long it takes for conversations to be resolved, calculated as the time between when a conversation is created and when it is marked as closed. Only conversations that have been closed are included in this metric. If a conversation is reopened and closed again, only the most recent closure is counted. Conversations that remain open, or that are deleted or merged, are excluded. This metric helps you understand how efficiently your team is resolving customer issues over time |
| New Conversations per Hours | Counts the number of new conversation sessions you’ve got per day and hour, allowing you to know when you have the most need to support your customers. These counts inbound and outbound conversations sessions unless filtered out via the settings. |
| New Conversations per Channels | This metric displays the number of new conversations initiated during the selected time range, grouped by the channel through which they started. Conversations that do not have a channel at creation or whose channel is later deleted are grouped under “Unknown Channel.” Each conversation is counted once, according to its original channel, and only conversations created within the specified period are shown. |
| New Conversations per Teams | This metric shows the number of new conversations started within the selected time range, grouped by the team assigned at the moment the conversation began. If a conversation does not have a team at creation or the assigned team is later deleted, it is counted under “Unknown Team.” Each conversation is only counted once, based on its initial team assignment, and only those created within the chosen period are included. |
| New vs Closed Conversations | This chart compares the number of new conversations started with the number of conversations closed during each period in the selected date range. A conversation is counted as “opened” in the period when it was created, and as “closed” in the period when it reached a closed status—regardless of when it was opened. Conversations that are opened but not yet closed will only appear in the “opened” count, while those opened earlier but closed during the period will appear only in the “closed” count. Deleted conversations are excluded. This comparison helps you understand whether your team is keeping pace with new demand, or if conversations are accumulating over time |
| Response Time | Time an agent takes to reply to a customer’s inbound message, no matter who is assigned to the conversation. This metric excludes agent responses following a chatbot. |
| First Response Time | The time it takes for an agent to reply after a customer starts the conversation, no matter who is assigned to the conversation. |
| Number of messages before closure | The amount of outbound messages sent by the agent until the conversation gets closed. |
| Number of conversations closed on first assignment | The number of conversations an agent closed as the first agent assigned to a given conversation. |
Timezones: Times are automatically displayed based on your current UTC (Coordinated Universal Time) for consistency across regions.
Filters: Most of these metrics can be filtered by date range, team, tags, and channels, so you can zero in on a specific type of conversation or agent group.
4. Configuration
All these session features come with adjustable settings so you can tailor how data is captured and reported. In your Admin or Settings panel, you’ll find options to define working hours, set inactivity windows, and include or exclude outbound calls and bot interactions. By default, the system ignores these extra activities to focus on genuine agent-customer engagement. Key Setting Highlights:- Data aggregation: Helps you interpret your data based on average, median, min, max, or sum. Once changed, all aggregated metric on the report will be adjusted based on your selection.
- Working Hours: Determine which hours count toward response and resolution time.
- Inactivity Window: Decide when a session automatically closes (24 hours by default).
- Outbound & Bot Exclusion: Keep them excluded for pure agent metrics, or toggle them on if you need a comprehensive view of all interactions.