Access
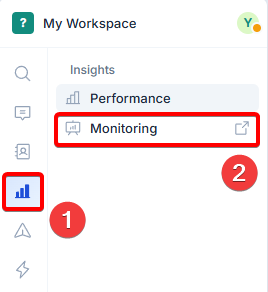
The Monitoring Dashboard can be accessed from going to Inbox > Monitoring: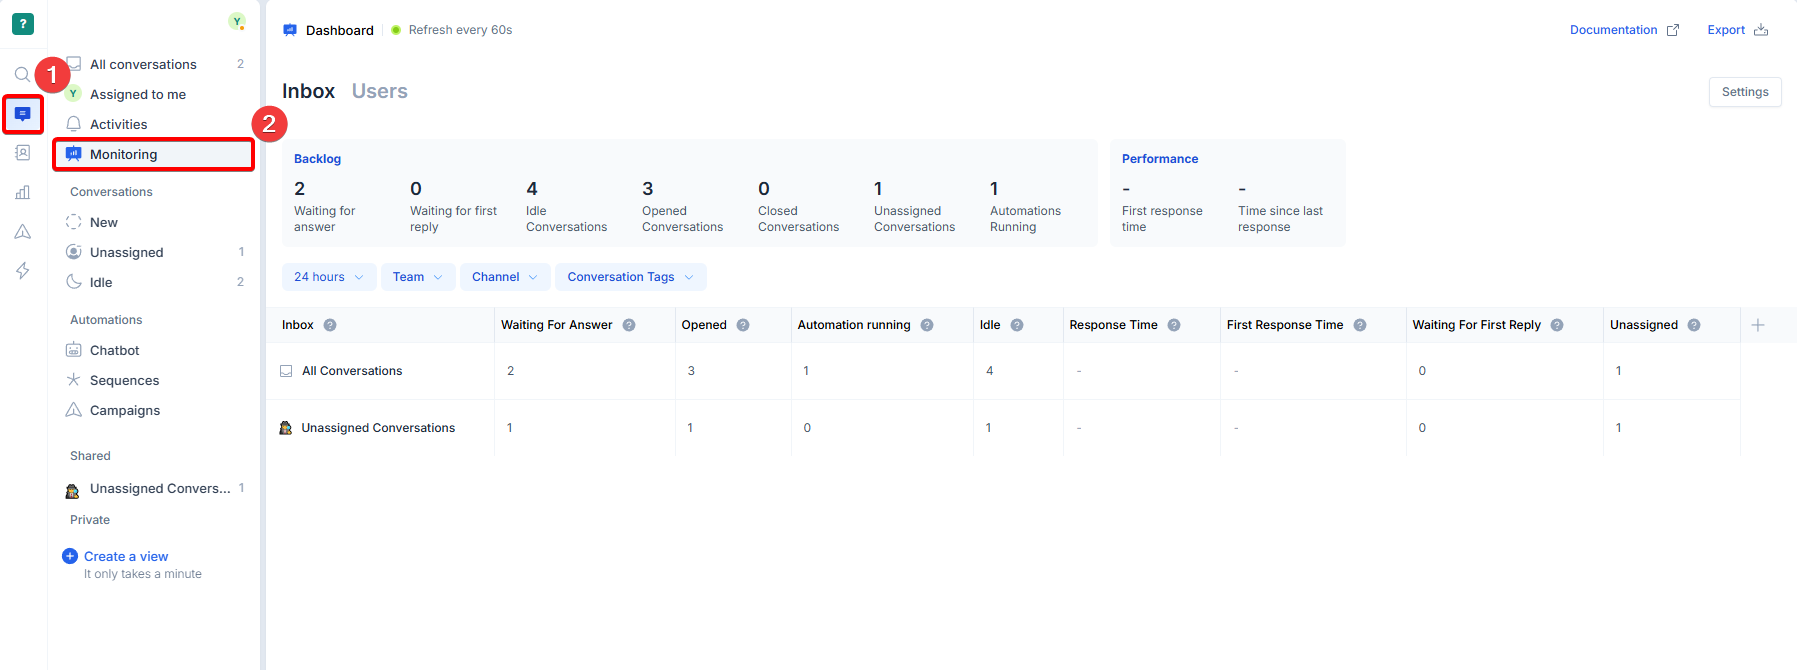
Permission
The Monitoring Dashboard belongs to the “Reporting” permission setting. Admins can control who has access to the dashboard from the permission settings page for roles. Roles with the Reporting permission set to View or Manage will be able to access the Monitoring Dashboard.
Dashboard structure
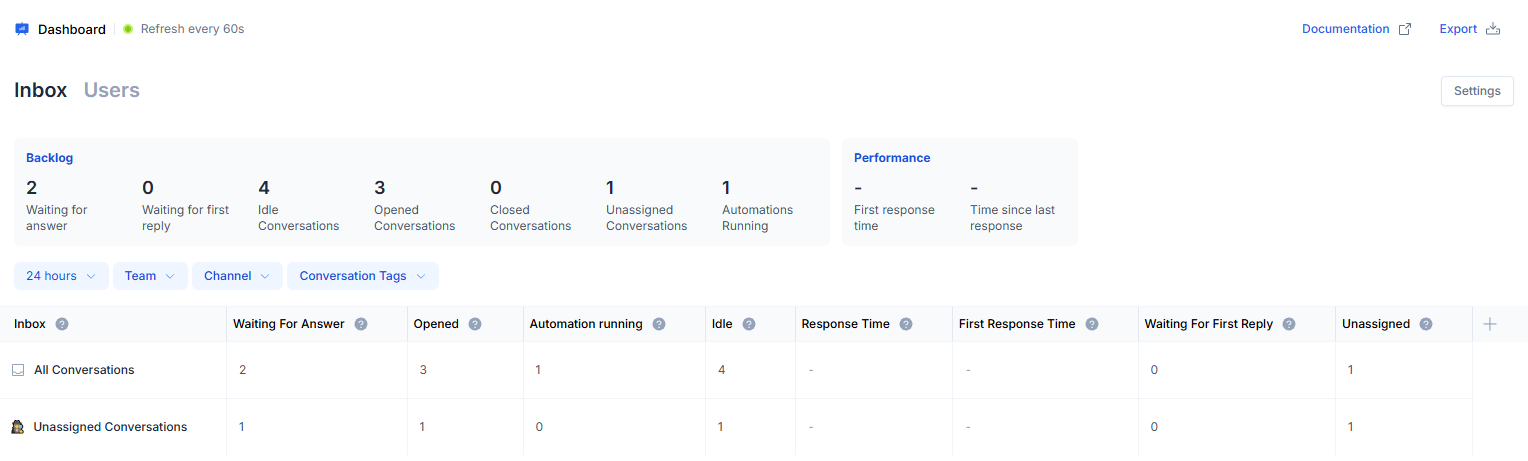
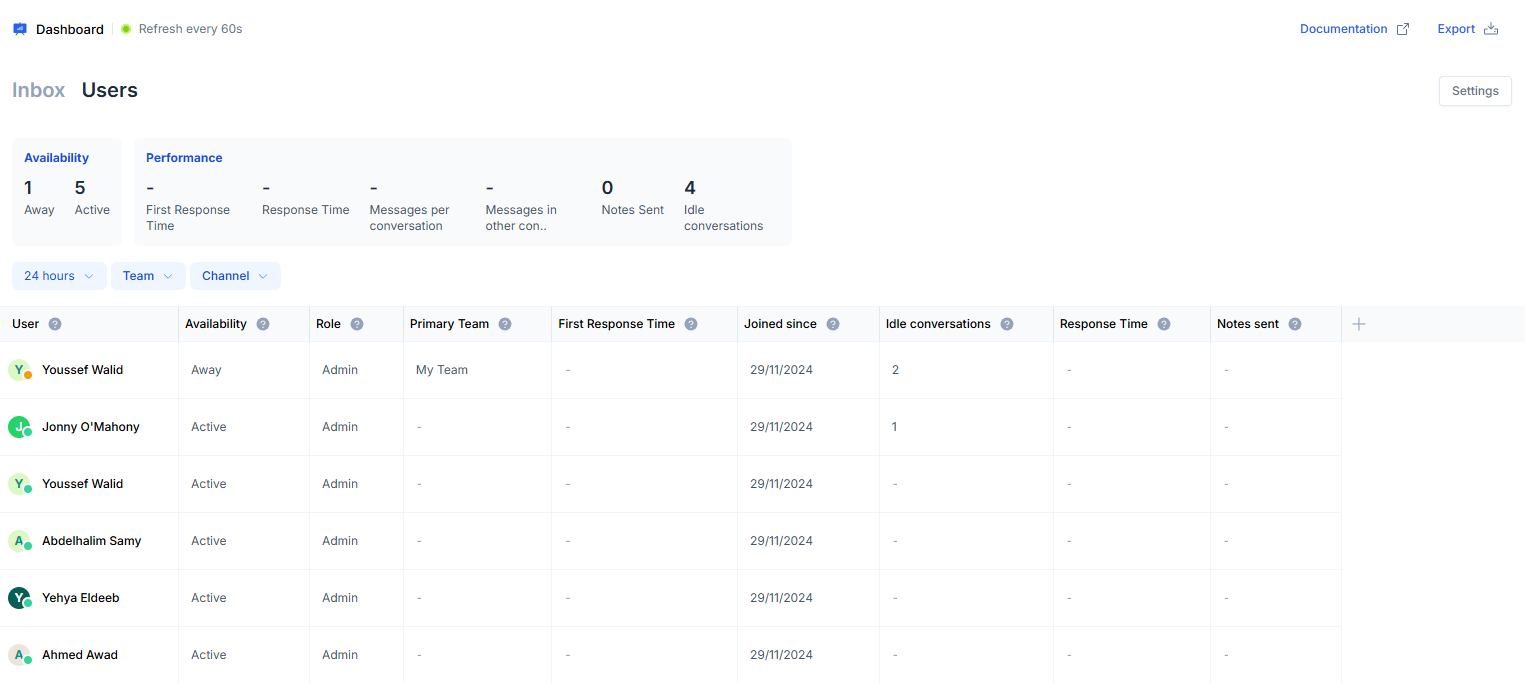
The Monitoring Dashboard is split into two main sections - Inboxes and Users, allowing managers to decide what they want to monitor at any given time. You can switch between the two sections by clicking on Inbox or Users at the top of the page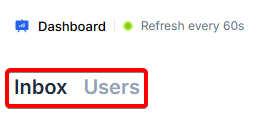
Refresh rate
The metrics are refreshed automatically every 60 seconds while this is your active browser tab. The top left corner of the Dashboard will indicate when the dashboard is refreshing the new metricsGlobal dashboard settings
From the top right corner, admins can control their metrics view using the global dashboard settings: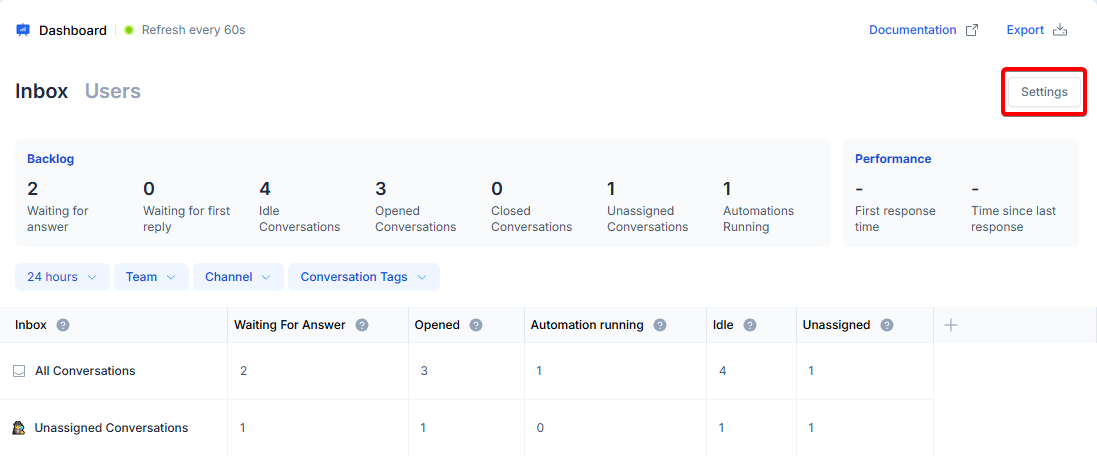
Note: **Any change to the settings affects both the ‘Inboxes’_, _and the ‘Users’ sections, as well as the summary cards.
**Note: **When Working Hours is enabled, the user’s primary team schedule will be taken in consideration when calculating Response Times. For example, if the user’s team schedule is between 9:00 AM and 5:00 PM, and a message has been received at 6:00 AM and have been replied to at 10:00 AM. Then the response time in this case will be 1 hour, which is the overlap between the team’s working hours and the reply interval.
Section-specific settings
There are some settings by which you can control the data specific to a certain section (Inboxes or Users)Inbox: Filters
Under the Inbox section, there are four different filters that you can apply to zoom further into the metrics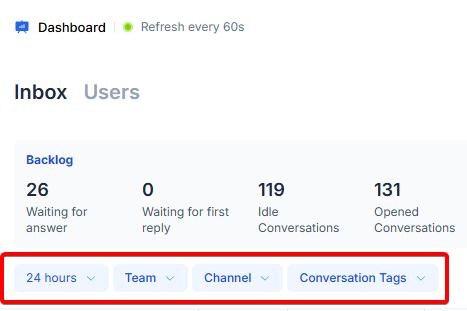
Users: Filters
Under the Users section, there are four different filters that you can apply to zoom further into the metrics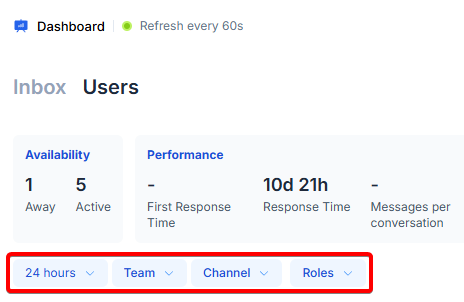
Removing metrics from the table
You can remove some metrics from the table if they are unwanted, simply hover over the column name, click on the down arrow to open the menu, and select Hide from table
Adding more metrics to the table
Not all metrics are shown by default, you can choose to preview more columns by clicking on the (➕) button at the end of the table, then choosing which metric you would like to add